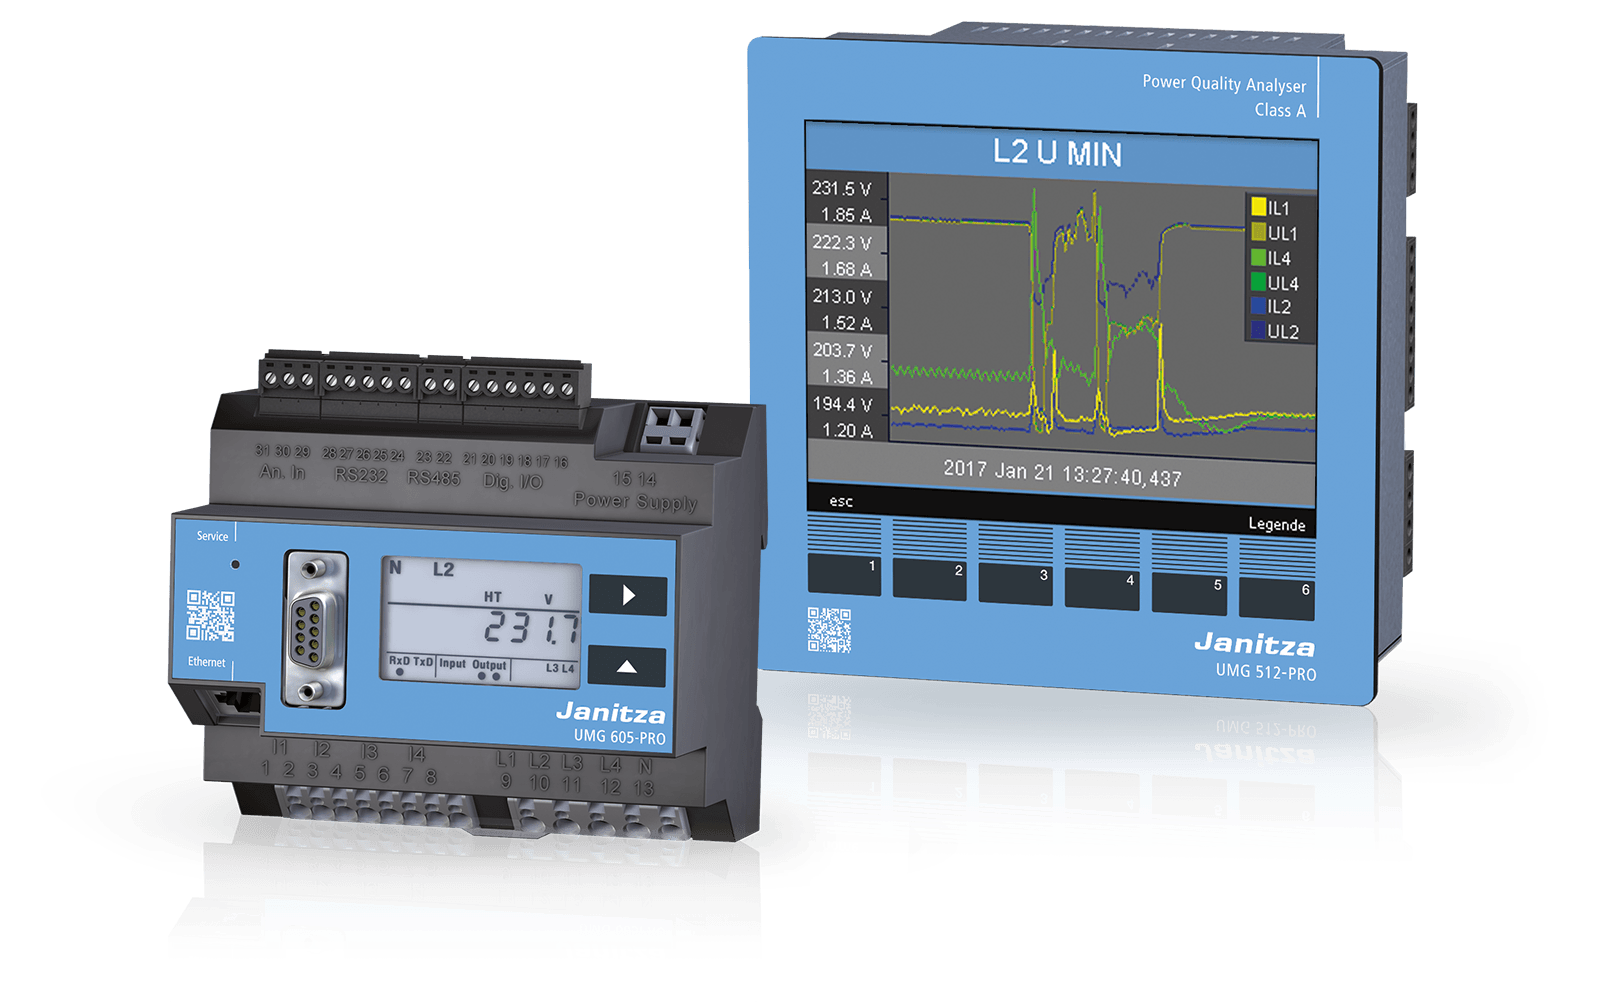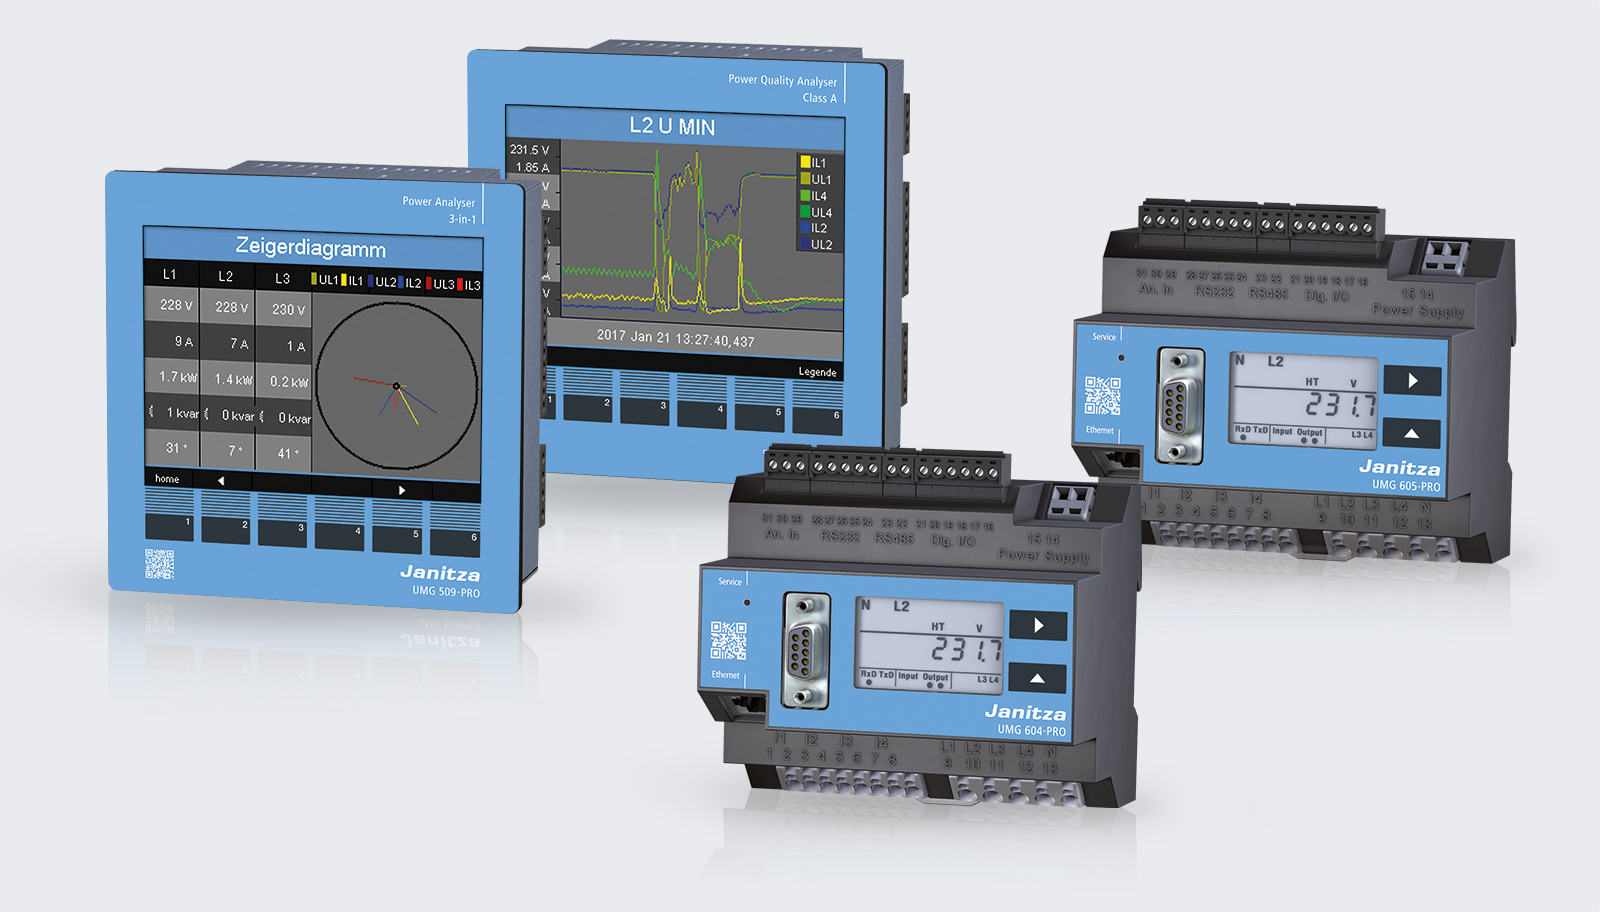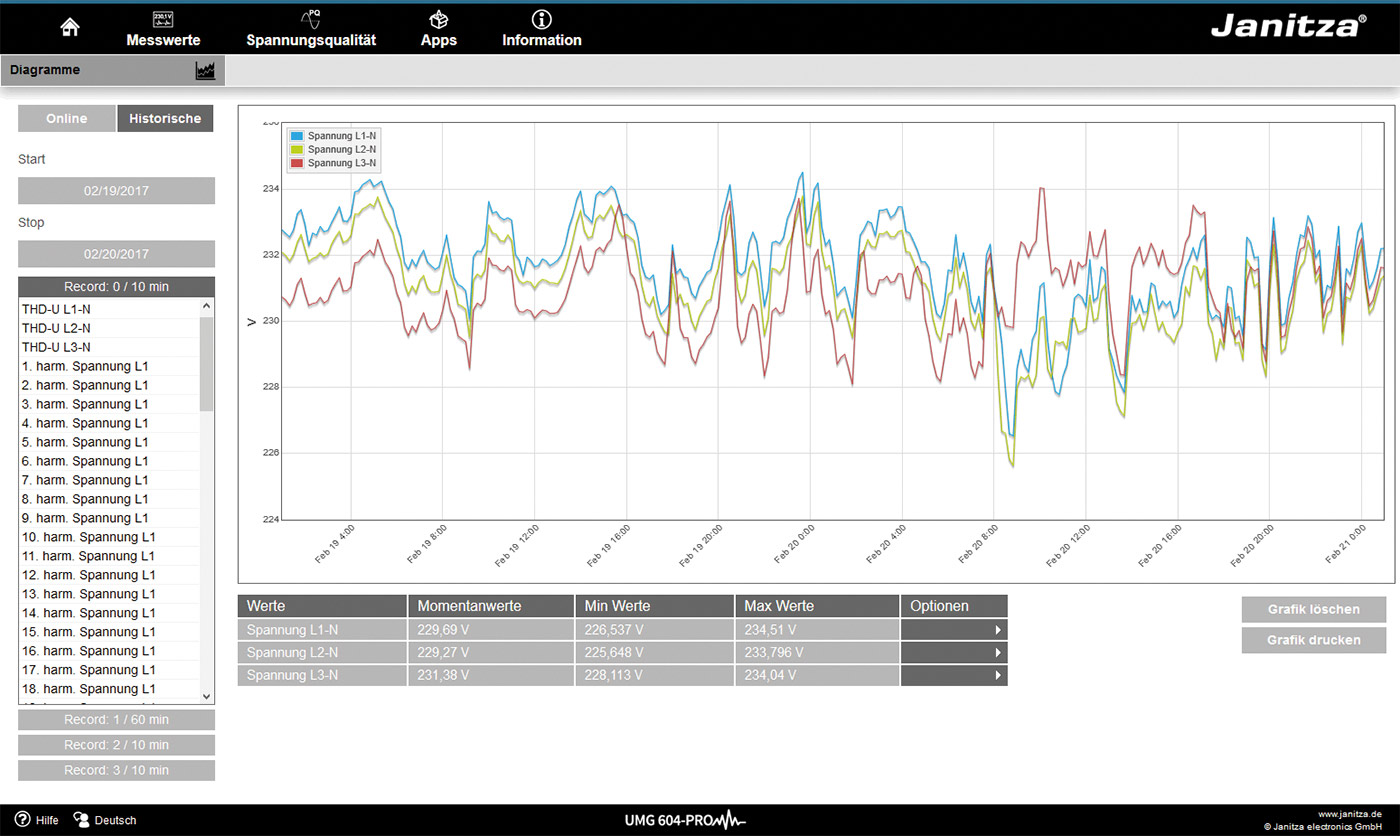
Configurable display of current and historical measured values with automatic scaling. Graphical representation on the device's own homepage without additional software installation.
The “Measurement monitor” APP shows a user-defined selection of real-time measured values as well as historical measured values from the internal memory, in the form of diagrams on the homepage of a Janitza UMG device. The most important measured values for the user are shown graphically in a visually attractive manner through the “drag & drop” function. The time window of the historical measurement data can be scaled by the user directly in the diagram. The detailed view of the graphs is thus interactive.
Scaling is automatic when displaying real-time measured values. Alongside the colourcoding of the diagram presentation, it is also possible to export the graphs as graphics files.
Data can be simply analysed at a first glance with the help of this graphical preparation. The web-based solution offers the advantages of constant availability, both on mobile end devices and on computers.
Your benefits:
- Access to current and historical measured values
- Display with scalable timebase
- Quick and easy operation with “drag & drop”
- Web-based solution without additional software installation
- Can be called up on different devices such as PC, Laptop, Tablet and Smartphone

